Zie bijgaande pdf (open_doorkijk_visiedocument_v1.1) voor mijn visie op de ontwikkeling van algemeen nut beogende software.
Auteur: jeroen
You can see it here: https://www.youtube.com/watch?v=vY_LZQ_8udU
Categorieën
Communicating with REST to CMDBuild
Intro
Hi. Today I like to talk about a nice open source tool called CMDBuild. CMDBuild is an excellent open source project that you can use at the heart of your IT structure. It offers you a web-interface that allows you to define objects and their relations. Once done you can use CMDbuild to enter information for these objects.
Example: you define an object “server” and and object “IP-address”. You define a 1-to-n relation from “server” to “IP-address”. Once done you can add servers to a list of server-objects and add IP-objects to server objects.
This is all fine and dandy but why would you like to do this? Well, after setting up the way you organize your infrastructure (eg: you could define on top of the server-objects “application”-objects to which servers belong, or locations where servers are located, etc.) you can use this information to hook up other systems.
As an example: knowing the IP-address of a server and it’s application you can instruct the monitoring application Zabbix to apply a certain template to automatically setup monitoring for that server.
Now the next challenge is how to get information out of CMDBuild. For this the application offers a SOAP and a REST interface.
For IT-newbies: This is the preferred way to communicate with an application. Yes, you can write a slick SQL Select statement to get the info out of the database but who guarantees you that after the next update the database model isn’t seriously altered?
There is only one challenge: there is a lot of documentation for the application (user manual, administration manual, web services manual) and once you get it working it’s all downhill from there. The catch is to get a small example running using only the current documentation.
Side note: allthough I have no ties to the CMDBuild organization I urge all readers who are using CMDBuild professionally to also buy themselves a support contract with the CMDBuild programmers firm Tecnoteca . Why? Well, if you place such a thing in the core of your infrastructure would you accept the risk that they go belly up because everybody uses the software thinking it’s a free ride? No. For a small amount of money you buy yourself peace of mind that you’ve done the right thing. And the fact that it provides you with excellent support is an added bonus.
Techno-speak
After a lot of trial and error on my part I got an example curl script from Tecnoteca that succesfully talks to the REST interface. It looks like this:
curl -v -X POST 'http://yourcmdbuildurl.nl/cmdbuild/services/rest/v1/sessions' -H "Content-Type: application/json" --data-binary '{"username": "admin", "password": "yourpassword"}' | json_pp
After checking that this script works and it gives you some meaningfull json output I got back to work.
When using the REST interface of CMDBuild you have first have to authenticate to it and get a token that identifies your session in subsequent REST calls. So the authentication token is important to have. Without it, you’re stuck.
First challenge was to make the same functionality work in Python. In the end this is what I wrote:
#!/usr/bin/python

import requests, json, pprint
import os,sys
from pprint import pprint
from prettytable import PrettyTable
from requests.auth import HTTPDigestAuth
import logging


## The next lines enable debugging at httplib level (requests->urllib3->http.client)
## You will see the REQUEST, including HEADERS and DATA, and RESPONSE with HEADERS but without DATA.
## The only thing missing will be the response.body which is not logged.
#try:
#    import http.client as http_client
#except ImportError:
#    # Python 2
#    import httplib as http_client
#http_client.HTTPConnection.debuglevel = 1
#
## You must initialize logging, otherwise you'll not see debug output.
#logging.basicConfig()
#logging.getLogger().setLevel(logging.DEBUG)
#requests_log = logging.getLogger("requests.packages.urllib3")
#requests_log.setLevel(logging.DEBUG)
#requests_log.propagate = True

print "***************************************************************"
print "*** Login and get authentication token "
print "***************************************************************"

cmdbuild_url = "http://server:8080/cmdbuild/services/rest/v2/sessions/"
data = {'username': 'soap', 'password': 'secret'}
headers = {'Content-type': 'application/json', 'Accept': '*/*'}
r = requests.post(cmdbuild_url, data=json.dumps(data), headers=headers)

print r.json()
r1=r.json()
sessionid=r1["data"]["_id"]
print "***************************************************************"
print " Authentication token is : " + sessionid
print "***************************************************************"


print "***************************************************************"
print "*** Session info"
print "***************************************************************"
#curl -v --trace-ascii - -X GET "http://server:8080/cmdbuild/services/rest/v1/sessions/${id}" -H "Content-Type: application/json"

cmdbuild_url = "http://server:8080/cmdbuild/services/rest/v2/sessions/"+sessionid
headers = {'Content-type': 'application/json', 'Accept': '*/*', 'CMDBuild-Authorization': sessionid }
r = requests.get(cmdbuild_url, data=json.dumps(data), headers=headers)
print r.json()
pprint(r.json())
There is a lot more to say about this, but basically, when you made this work you can read the manual, get the WSDL, find the REST endpoints you can call and download the WADL that also lists the available endpoints for your version of the software.
Advanced stuff
Now that you’ve got your hands dirty on some easy REST stuff let’s look at something more complex. The CMDBuild system is filled with objects called “classes”. Let’s first get a list of classes:
print "***************************************************************"
print "*** Classes "
print "***************************************************************"
#curl -v --trace-ascii - -X GET 'http://server:8080/cmdbuild/services/rest/v1/classes' -H "Content-Type: application
/json" -H "CMDBuild-Authorization: ${id}"

cmdbuild_url = "http://server:8080/cmdbuild/services/rest/v2/classes"
headers = {'Content-type': 'application/json', 'Accept': '*/*', 'CMDBuild-Authorization': sessionid }
r = requests.get(cmdbuild_url, data=json.dumps(data), headers=headers)
print "There are " + str(r.json()["meta"]["total"]) + " results"
#print r.json()
pprint(r.json())
Now that we have our list of classes in the system we can loop through them and get the individual details of every class:
for value in r.json()["data"]:
 print "\nTrying to get cards for : " + value["_id"]
 id=value["_id"]
 #for id in value["_id"]:
 #pprint(id)
 print "Getting id: " + id

 print "***************************************************************"
 print "*** Class '"+id+"'"
 print "***************************************************************"
 #Asset
 cmdbuild_url = "http://server:8080/cmdbuild/services/rest/v2/classes/" + id
 headers = {'Content-type': 'application/json', 'Accept': '*/*', 'CMDBuild-Authorization': sessionid }
 r = requests.get(cmdbuild_url, data=json.dumps(data), headers=headers)
 #print "There are " + str(r.json()["meta"]["total"]) + " results for class " + id + "?"
 #print r.json()
 pprint(r.json())

 print "***************************************************************"
 print "*** Class '"+id+"' attributes"
 print "***************************************************************"
 # GET .../classes/Asset/attributes
 cmdbuild_url = "http://server:8080/cmdbuild/services/rest/v2/classes/" + id + "/attributes"
 headers = {'Content-type': 'application/json', 'Accept': '*/*', 'CMDBuild-Authorization': sessionid }
 r = requests.get(cmdbuild_url, data=json.dumps(data), headers=headers)
 print "There are " + str(r.json()["meta"]["total"]) + " results for class " + id + " attributes "
 #print r.json()
 pprint(r.json())

 print "***************************************************************"
 print "*** Class '"+id+"' cards"
 print "***************************************************************"
 #GET .../classes/Asset/cards
 cmdbuild_url = "http://server:8080/cmdbuild/services/rest/v2/classes/" + id + "/cards"
 headers = {'Content-type': 'application/json', 'Accept': '*/*', 'CMDBuild-Authorization': sessionid }
 r = requests.get(cmdbuild_url, data=json.dumps(data), headers=headers)
 print "There are " + str(r.json()["meta"]["total"]) + " results for class " + id + " cards "
 #print r.json()
 pprint(r.json())
Happy programming!
Update 1:CMDBuild builders Tecnoteca tweet about this posting:
Update 2: Follow-up testimonial publised on the website of the CMDBuild builders Tecnoteca: article
Update 3: I got permission from Deltares to publish the sourcecode to a small CMDBuild python library module.
In Libreplan, State of the Union 2015, I want to talk about what happened this year and what my plans are for the next.
 One year as past since I took over as project leader for the open source LibrePlan project from the excellent people of Igalia. Of course that is not my complete involvement with the project. I started as the Dutch language translator some 3 years ago. This year a lot has happened and a lot didn’t happen.
I would like to share with you my adventures with the LibrePlan project. I would like to tell you what happened this year, what didn’t happen and what will happen in the, hopefully near, future.
What did happen?
- I wrote “LibrePlan, the missing manual” in Q1 of 2014. So far over 75 copies were sold and this makes this my most successful self-publishing book to date!
- I answered every email send to info@libreplan.com and helped people using the application and discussed their wishes with them. This amounts to 294 separate questions that I answered. 29 of these were if LibrePlan could be installed on Windows (yes, that is possible but you have to figure it out all by yourself).
- I regularly cleaned the Q and A site where spammers keep trying to sell crap.
- I discussed wishes with over 50 individual companies.
- I traveled to France and did 5 training sessions there for one organisation. Great stuff!
- I contacted several Java programmers to be able to response to customer requests should they occur.
What did not happen?
- A new LibrePlan release.
You might ask yourself why? Now this is were the story becomes a little personal but I will tell you anyway. But if you are used to corporate marketing bla bla only I suggest you skip the next part and go straight to the “What will happen?” section as you are probably only interested in solid results. 🙂
I want to sh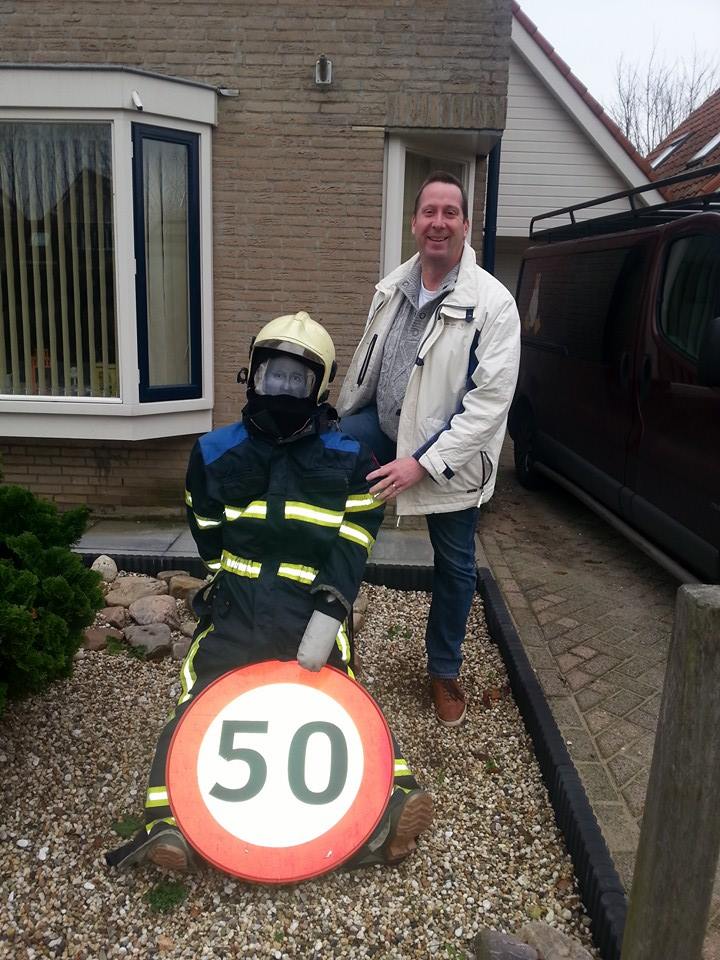 are with you the reasons why there has not been a release yet. One thing is that I lost my day job 1st of January and I have been busy trying to find a new one. Being 50 years of age in a time of economic slum turned out not to bode well for this. Not even the fact that I am a volunteer fire fighter in my community makes any difference :-). I am not in the habit of torching places of work so, combined with the relatively optimistic economic growth forecasts I expect to find a job soon.
 Another reason for the absence of a new release is that I have a very lovely stepdaughter. She loves to take a computer apart just for fun! Upon closer inspection of the picture you might see that she sits in a wheelchair. She was born 17 years ago with spina bifida and recently underwent here 43th surgery. Needless to say there is an extremely high level of care taking involved. Did I mention that we have a total of 5 kids to care for, two of which with disabilities? If you can read Dutch we have a website were we inform all members of the family about health issues and progress. Last June it became clear that keeping here living at home was no longer a reasonable option. So from October onwards she started living somewhere else and she visits us regulary. These recent events have had a tremendous impact on all our lives. It will take some time before the deep level of fatigue will subside but both my wife and I are also very optimistic in this regard.
What will happen?
Now this is an excellent question! What will happen? And when? Well, I found out the hard way that communicating solid deadlines is a sure thing to make people unhappy. What I can do is share with you my plans. You may even call it a roadmap. Here it is:
- Make a new release, most likely 1.4.1.
- Set up a stable build environment, most likely on openSuSE Build Service, where I can easily build packages for several distributions at once.
- Make a new release, most likely 1.5.0 where margins are introduced.
- Merge the existing Risk/Issue log code and finish it.
- Add email functionality to the program to inform users of changes.
- Add a pipeline page to show, well, err, the pipeline of projects.
- Add documents functionality to be able to add documents to a project.
- Add a GOTIK report. I know, GOTIK is a Dutch abbreviation meaning Money, Organisation, Time, Information and Quality. So it will probably be a MOTIQ report.
As you can see there are enough plans. Will they all happen? I don’t know, but I am sure as hell gonna try! When will they happen? As soon as I can. That is my promise to you.
Kind regards,
Jeroen Baten
P.S. Normally I do not accept replies to posts because I think there are enough other places on the Internet where people can vent. But this time I am curious about your thoughts. So tell me.
Personal intro
Before I start describing what I did I have to talk a little bit about some private stuff.
I have a stepdaughter, named Anouschka, who was born severely disabled, who is now 17 years old and had here 43th surgery last June. After here last surgery she developed the need for supplimental oxygen at night. She had a polysomnography (a one night sleep study) shortly after.
The study showed that her need for supplimental oxygen at night was “in the grey arrea”. This means that it is neither a definite “yes” nor “no”.
And her doctor said that of course data gathered at home would give a much clearer picture.
This triggered me, being a long time IT guy, to see what I could do.
IMPORTANT NOTE: All the time we tuned the level of oxygen given our stepdaughter was continously monitored using the RAD-8 monitor as well as
her personal fysician from a renowned Dutch hospital. Of course there were all kinds of critical alarm settings continously in place.
The start
A couple of days later we got a Philips Everflo oxygen concentrator and a Masimo RAD-8 saturation measurement device. The RAD-8 turned out to have a serial port on the back panel. When configuring the RAD-8 to use the serial port in the “ASCII 2” setting (if I remember correctly) would spit out one line of information every 2 seconds at 9600 Baud 8-n-1 like this:
00/00/00 00:00:03 SN=0000051252 SPO2=---% BPM=--- PI=--.--% SPCO=--.-% SPMET=--.-% DESAT=-- PIDELTA=+-- ALARM=0000 EXC=000000\r\n
This was something I could work with.
I created a MySQL table to store the data received and used a Python program to capture the serial output and send it to the MySQL database.
This is the layout of the MySQL table:
CREATE TABLE `data` (
  `id` int(11) NOT NULL AUTO_INCREMENT,
  `tijd` datetime DEFAULT NULL,
  `data` varchar(150) DEFAULT NULL,
  `spo2` int(11) DEFAULT NULL,
  `bpm` int(11) DEFAULT NULL,
  `session` timestamp NOT NULL DEFAULT '0000-00-00 00:00:00',
  `tijd3` timestamp NOT NULL DEFAULT CURRENT_TIMESTAMP,
  KEY `id` (`id`),
  KEY `session_index` (`session`),
  KEY `tijd_index` (`tijd`),
  KEY `spo2_index` (`spo2`)
)
And the Python program I wrote looked like this:
#!/usr/bin/python
print "Loading libraries"
import serial, time,  os
import logging
import logging.handlers
import MySQLdb
import datetime

version="1.0"

def log(msg):
  print msg
  my_logger.debug(os.path.basename(__file__)+":"+msg)

print "Initialising logging"
my_logger = logging.getLogger('MyLogger')
my_logger.setLevel(logging.DEBUG)
handler = logging.handlers.SysLogHandler(address = '/dev/log')
my_logger.addHandler(handler)

log("Log-RAD-8 version "+version)
log("Copyright 2014 J. Baten")
log("")
log("Logging serial data from Masimo RAD-8 serial port")
log("Note: Works only with RAD-8 serial port set to 'ASC1'")
log("")
#my_logger.debug('this is debug')
#my_logger.critical('this is critical')

log("Initialising database connection")
#setting up database connection
try:
    conn = MySQLdb.connect(host= "10.1.1.1", user="lograd8",  passwd="lograd8",  db="lograd8")
except MySQLdb.Error, e:
    log( "ERROR %d IN CONNECTION: %s" % (e.args[0], e.args[1]))
#except MySQLdb.Error:
    #log("ERROR IN CONNECTION")
    exit(2)
x = conn.cursor()
#x.execute("SELECT *  FROM anooog1")
#x.execute (" INSERT INTO anooog1 VALUES ('%s','%s') ", (188,90))
#row = x.fetchall()

now = datetime.datetime.now()
#print now
log("Program started at "+str(now))
#today8am = now.replace(hour=8, minute=0, second=0, microsecond=0)
today = datetime.datetime.today()
#print today
one_day = datetime.timedelta(days=1)
tomorrow = today + one_day
#print 'Tomorrow :', tomorrow
endtime= tomorrow.replace(hour=8, minute=0, second=0, microsecond=0)
log("Logging should stop at "+ str(endtime))

#initialization and open the port
#possible timeout values:
#    1. None: wait forever, block call
#    2. 0: non-blocking mode, return immediately
#    3. x, x is bigger than 0, float allowed, timeout block call
log( "Initializing port")
ser = serial.Serial()
#ser.port = "/dev/ttyUSB0"
ser.port = "/dev/ttyS0"
#ser.port = "/dev/ttyS2"
ser.baudrate = 9600
ser.bytesize = serial.EIGHTBITS #number of bits per bytes
ser.parity = serial.PARITY_NONE #set parity check: no parity
ser.stopbits = serial.STOPBITS_ONE #number of stop bits
#ser.timeout = None          #block read
ser.timeout = 1            #non-block read
#ser.timeout = 2              #timeout block read
ser.xonxoff = False     #disable software flow control
ser.rtscts = False     #disable hardware (RTS/CTS) flow control
ser.dsrdtr = False       #disable hardware (DSR/DTR) flow control
ser.writeTimeout = 2     #timeout for write
try:
    log( "Trying to open serial port")
    ser.open()
except Exception, e:
    log( "error open serial port: " + str(e))
    exit(1)
if ser.isOpen():
    log( "Port succesfully opened")
    try:
        log( "Flushing port data")
        #flush input buffer, discarding all its contents
        ser.flushInput()
        #flush output buffer, aborting current output
        ser.flushOutput()
        #and discard all that is in buffer
        #write data
        #ser.write("AT+CSQ")
        #time.sleep(0.5)  #give the serial port sometime to receive the data
        while True:
            response = ser.readline()
            #response = "TESTDATA 09/01/14 04:01:41 SN=0000051252 SPO2=092% BPM=086 PI=01.03% SPCO=--.-% SPMET=--.-% DESAT=-- PIDELTA=+-- ALARM=0000 EXC=000800"
            print response
            response = MySQLdb.escape_string(response)
            print(response)
            if (len(response)>5):
                try:
                    x.execute ("INSERT INTO data (tijd,data) VALUES (now(),%s) ", response)
                    conn.commit()
                except MySQLdb.Error, e:
                    log( "ERROR %d IN CONNECTION: %s" % (e.args[0], e.args[1]))
                    log( "Last query was: "+ x._last_executed )
            # Is it time to stop yet?
            #endtime= now+ datetime.timedelta(seconds=5)
            now = datetime.datetime.now()
            if (now > endtime):
                break
        ser.close()
    except Exception, e1:
        log( "error communicating...: " + str(e1))
else:
    log( "cannot open serial port ")
conn.close()
As you can see I added some logging and even made it possible to run for a specific length of time. In the end I did not need that because as soon as the RAD-8 was turned of the serial port would of course be silent hence there would be no data.
The data
After the first night I had some records. Actually I had approximately 36.000 records. But there where some pittfalls. The timestamp of the RAD-8 was not the actual timestamp. So I had to add a timestamp field to the MySQL table. And it would be nice if I could easily select the data for one night. Unfortunately that means from somewhere around 20:00 until 8:00 the next day!
I made life easier for me by adding a column called “session” that would take the timestamp and subtract 12 hours from it. This way I could very easily make selections for one specific date.
I also wanted to have the SPO2 (O2 saturation) and the BPM (heart Beats Per Minute) in a separate column.
These three things are acomplished by the following SQL commands;
update data set session=DATE_SUB(tijd, INTERVAL 12 HOUR) where spo2 is null;
update data set spo2=substring(data,38,3) where spo2 is null;
update data set bpm=substring(data,47,3) where bpm is null;
(I know, I could make a trigger to do this automagically, but I just never got round to it)
Analysing the data
After some two weeks of capturing data I had 700.000 records. Now capturing and storing data is one thing, but without analysing it, what’s the point?
My first analyses was a simple SQL query to get some hourly averages, minimum and maximum values, etc.
mysql> select
  date_format(tijd,'%d/%m/%Y %H') as date_hour,
  count(*) as measurements,
  avg(spo2) as avg_spo2,
  std(spo2) as std_spo2,
  max(spo2) as max_spo2,
  min(spo2) as min_spo2,
  avg(bpm) as gem_bpm,
  std(bpm) as std_bpm,
  max(bpm) as max_bpm,
  min(bpm) as min_bpm
from data
  group by date_format(session,'%d/%m/%Y %H');

+---------------+--------------+----------+----------+----------+----------+----------+---------+---------+---------+
| date_hour     | measurements | avg_spo2 | std_spo2 | max_spo2 | min_spo2 | gem_bpm  | std_bpm | max_bpm | min_bpm |
+---------------+--------------+----------+----------+----------+----------+----------+---------+---------+---------+
| 02/09/2014 15 |          117 |  16.3248 |  35.9541 |       96 |        0 |  12.1795 | 26.8250 |      73 |       0 |
| 02/09/2014 20 |          279 |  93.2652 |  20.8964 |      100 |        0 |  77.1470 | 23.0635 |      97 |       0 |
| 02/09/2014 21 |         3601 |  99.3913 |   0.5947 |      100 |       98 |  79.8578 | 13.9956 |     111 |      58 |
| 02/09/2014 22 |         3600 |  98.3753 |   0.6046 |      100 |       97 |  69.2242 |  6.0704 |      91 |      59 |
| 02/09/2014 23 |         3601 |  98.1086 |   0.5884 |      100 |       96 |  65.5959 |  3.8593 |      89 |      56 |
| 03/09/2014 00 |            2 |  98.0000 |   0.0000 |       98 |       98 |  66.0000 |  0.0000 |      66 |      66 |
| 03/09/2014 20 |          343 |  94.2915 |  18.0130 |      100 |        0 |  94.8513 | 19.8918 |     107 |       0 |
| 03/09/2014 21 |         3600 |  97.4208 |   1.1367 |      100 |       95 |  91.4211 |  9.7283 |     113 |      71 |
| 03/09/2014 22 |         3601 |  96.2869 |   0.6961 |       98 |       89 |  77.9431 |  5.7278 |      96 |      62 |
| 03/09/2014 23 |         3600 |  96.4931 |   0.9354 |      100 |       95 |  69.1972 |  8.0643 |      97 |      56 |
| 04/09/2014 00 |         3601 |  97.5301 |   0.7060 |       99 |       94 |  74.3510 |  7.4690 |      93 |      60 |
| 04/09/2014 01 |         3600 |  98.1533 |   0.6415 |      100 |       95 |  77.2231 |  7.2076 |     108 |      60 |
| 04/09/2014 02 |         3601 |  97.8970 |   0.8599 |      100 |       94 |  69.5146 |  6.6820 |      91 |      58 |
| 04/09/2014 03 |         3601 |  97.5260 |   0.9520 |      100 |       95 |  79.5568 |  6.2660 |      98 |      64 |
| 04/09/2014 04 |         3600 |  98.6144 |   0.7270 |      100 |       96 |  72.4103 |  6.7762 |     100 |      60 |
| 04/09/2014 05 |         3601 |  98.0297 |   0.8958 |      100 |       96 |  73.6409 |  6.6742 |      96 |      58 |
| 04/09/2014 06 |         3600 |  98.5117 |   1.0214 |      100 |       95 |  75.9700 |  8.9882 |     111 |      59 |
| 04/09/2014 07 |           51 | 100.0000 |   0.0000 |      100 |      100 |  84.2941 |  3.0888 |      91 |      81 |
+---------------+--------------+----------+----------+----------+----------+----------+---------+---------+---------+
I wanted to graph my data, quick and dirty. So I configured my public_html folder (did I mention that I do all of my work on a Linux workstation?) and started building something in PHP.
Graphing the data using PHP
Now, finding a PHP graphic library turned out to be not so easy as I thought. I had used JpGraph before, but Google and also Google Trends showed me it was not the leader of the pack anymore. There were some promising alternatives though. At first I started with JQuery and the Google Charts library. It’s from Google so it cant be bad, right? Wrong! It turned out to be a rather complicated chore involving reformatting dates and times to individual arrays and what not. At some point a post on a forum pointed me to the briljant Dygraphs library. And all it needed was some headers and CVS data. So I rebuild my AJAX scripts to generate CVS data and that was it!
At first I created a PHP “get-sat2.php” script to graph individual days. The PHP involved looks like this:
<!doctype html>
<html lang="en">
<head>
  <meta charset="utf-8">
  <title>Saturatie weergave</title>
  <link rel="stylesheet" href="jquery/jquery-ui.min.css">
  <link rel="stylesheet" href="get-sat.css">
  <script src="jquery/external/jquery/jquery.js"></script>
  <script src="jquery/jquery-ui.min.js"></script>
  <script type="text/javascript" src="dygraph-combined.js"></script>

  <script>
  $(function() {
    $( "#datepicker" ).datepicker({
        showButtonPanel: true
    });
  });

  $(function() {
    $( "input[type=submit], a, button" )
      .button()
      .click(function( event ) {
        event.preventDefault();
        console.log("submit event");
        drawChart();
      });
  });
  </script>

  <script>
  $(function() {
    $( "#datepicker" ).datepicker({dateFormat : 'yy-mm-dd'});
  });
  </script>

  <script type="text/javascript">

      function drawChart() {
         <!-- console.log("In drawChart"); -->
         var startdate  = "";
         if ($("#datepicker").hasClass('hasDatepicker'))
         {
           startdate  = $("#datepicker").datepicker('getDate',{dateFormat : 'yy-mm-dd'});
         }
         if (startdate != null ) {
           <!-- console.log(startdate); -->
           var day = startdate.getDate();
           var month = startdate.getMonth()+1;
           var year = startdate.getFullYear();
           startdate= year+"-"+month+"-"+day;
           console.log(startdate);

           g2 = new Dygraph(
             document.getElementById("chart_div"),
             "get-data2.php?startdate=" + startdate ,  // path to CSV file
             { // rollPeriod: 7,
              legend: 'always',
              animatedZooms: true,
              showRoller: true
              //errorBars: true,
              //valueRange: [40,100]}          // options
             }
           );
         }
      }
  </script>

  <script>
  if ($("#datepicker").hasClass('hasDatepicker')) {
    startdate  = $("#datepicker").datepicker('getDate');
    console.log(startdate);
}
  </script>
</head>
<body>

<p>Datum: <input type="text" id="datepicker"><input type="submit" value="Toon grafiek"></p>

<div id="wrap">
<h3>Stats</h3>
</div> -->
<div class="box" id="chart_div" style="width:95%">
<h3>Graph</h3>
</div>
</div><!--end wrap-->
</body>
</html>
Basically it draws a date selectorbox with calendar and after selecting a date, it gets input from the ajax php script “get-data2.php”.
The script looks like this:
<?php
    ini_set("error_reporting",E_ALL);
    syslog(LOG_DEBUG,"Start get-data.php");

    # get startdate parameter
    $startdate = $_GET['startdate'];
    syslog(LOG_DEBUG,$startdate);
    if (strlen($startdate) > 5 ) {

      # set db connection parameters
      $dbhost="10.1.1.1";
      #$dbhost="127.0.0.1";
      $dblogin="lograd8";
      $dbpwd="secret";
      $dbname="lograd8";

      $db =  mysql_connect($dbhost,$dblogin,$dbpwd);
      mysql_select_db($dbname);

      # // CSV or path to a CSV file.
      #    "Date,Temperature\n" +
      #    "2008-05-07,75\n" +
      #    "2008-05-08,70\n" +
      #    "2008-05-09,80\n"

      $rows  = "Tijd,SPO2,BPM\n";

      #$startdate = $_POST['startdate'];
      $former=0;

      $query = "SELECT tijd,spo2,bpm from data where date(session)='$startdate' order by session  ";
      syslog(LOG_DEBUG,"$query");
      $result = mysql_query($query);
      while($r = mysql_fetch_assoc($result)){
        #syslog(LOG_DEBUG,print_r($r,TRUE));
        $tijd=$r['tijd'];
        $tijd=str_replace("-","/",$tijd);
        $spo2=$r['spo2'];
        $bpm=$r['bpm'];
        #syslog(LOG_DEBUG,print_r($tijd,TRUE));
        if ( $spo2 > 0 ) {
          if ( $spo2 != $former ) {
            $rows = $rows.$tijd.",".$spo2.",".$bpm."\n";
            }
            $former=$spo2;
           }
      }
      syslog(LOG_DEBUG,print_r($rows,TRUE));
      #echo $cols . '"rows":[',$google_JSON_row ."]}";
      # output van json string to caller.
      echo $rows;

      # storage of json string for debugging purposes
      #$fh=fopen("/tmp/get-data.cvs","w");
      #fwrite($fh,$rows);
      #fclose($fh);

      mysql_close($db);
    }
    syslog(LOG_DEBUG,"End get-data.php\n\n");
?>
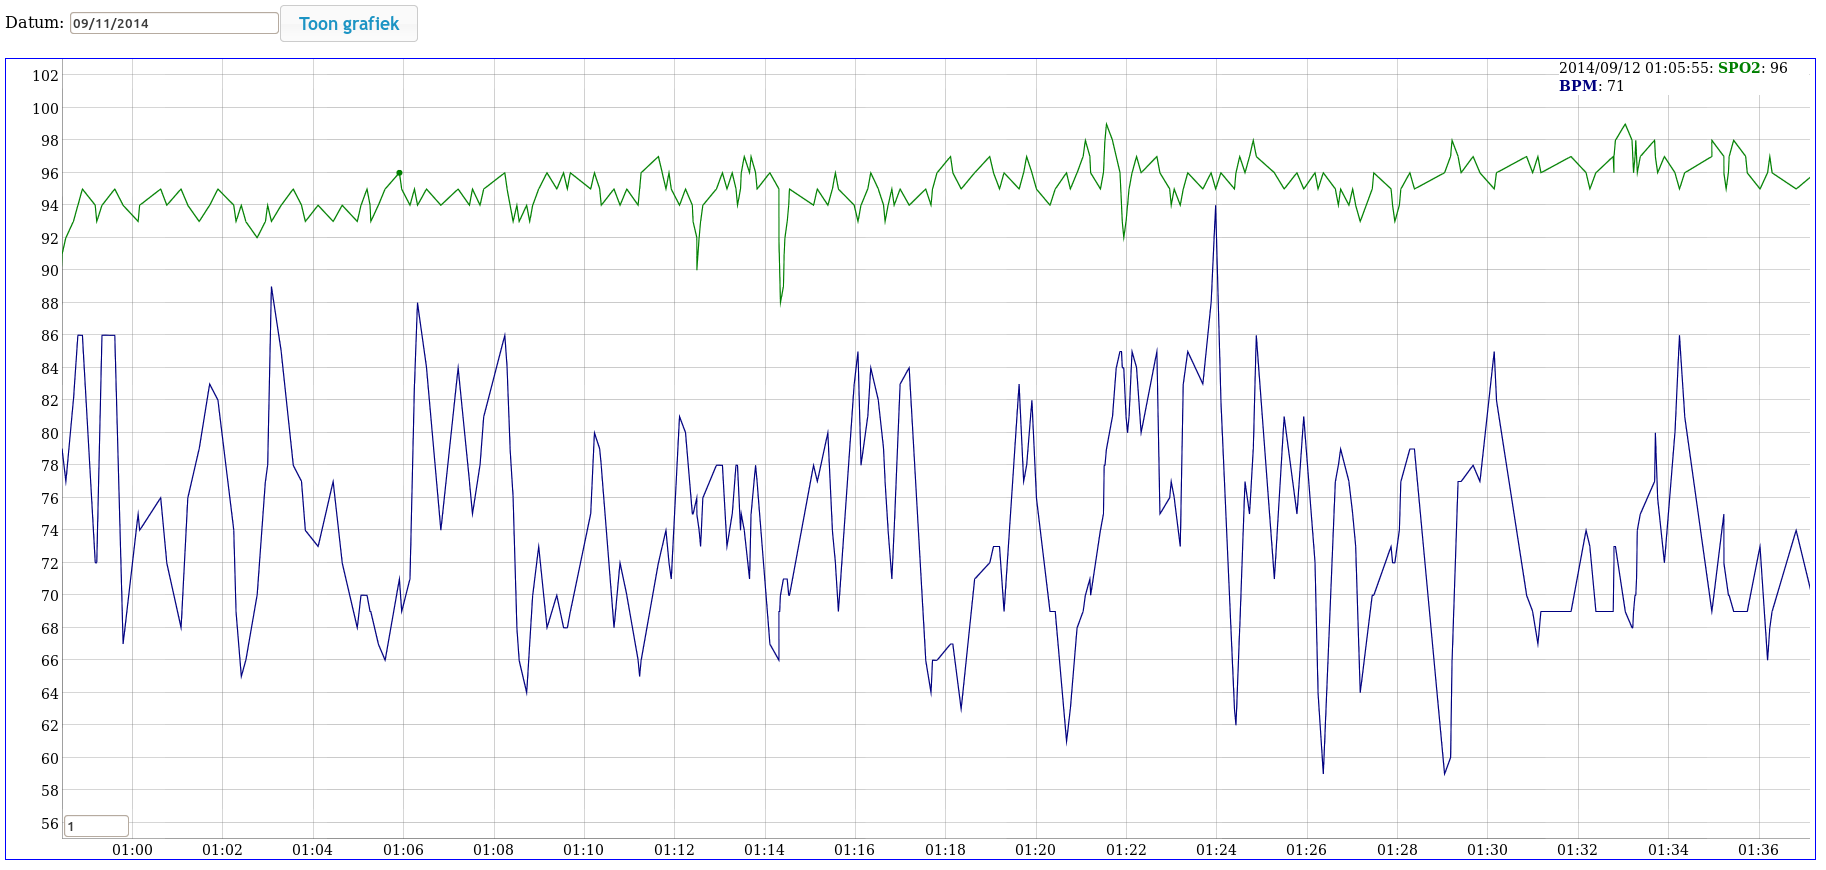
Both these PHP scripts result in the visualisation of the logged data like in this next picture:
The first picture shows you the data for september 11th 2014.
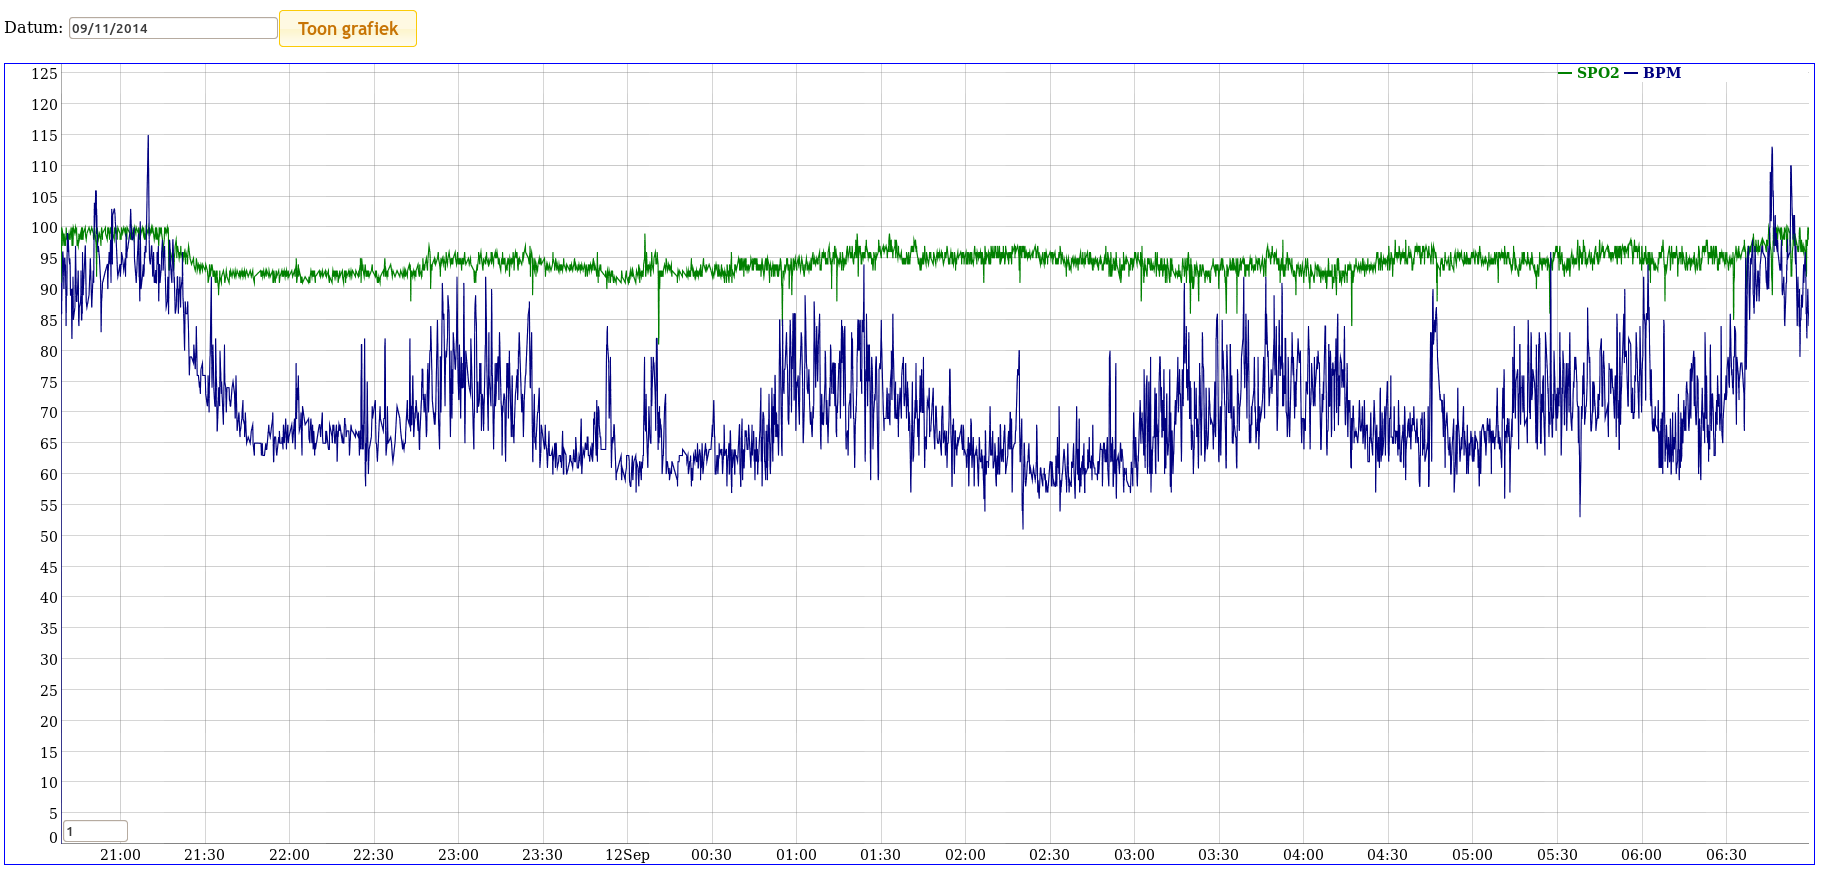
The second picture show you that DyGraph allows you to zoom in to the data.
You can play around with DyGraph settings like “rollPeriod” to tune the image to your liking.
In practice this graph turned out to be of little use. We played around with it for some time but to no avail.
We wanted to see the difference between giving oxygen and not giving oxygen.
Selecting a date that she got oxygen and compare it to a date where she did not get additional oxygen proved to be too difficult.
Graphing all data using PHP
At some point it occured to me to graph all data as shown in the first table of this article. This turned out to be a good idea.
I went to the code editor (again) and made a variantion of the earlier shown PHP script. This time with two seperated graphs.
One for the oxygen level and one for the heartbeat:
<!doctype html>
<html lang="en">
<head>
  <meta charset="utf-8">
  <title>Saturatie weergave</title>
  <link rel="stylesheet" href="jquery/jquery-ui.min.css">
  <link rel="stylesheet" href="get-sat.css">
  <script type="text/javascript" src="dygraph-combined.js"></script>

</head>
<body>

<div class="box" id="spo2_div" style="width:95%">
<h3>SPO2</h3>
</div>

<div class="box" id="bpm_div" style="width:95%">
<h3>SPO2</h3>
</div>
   <script>
           <!-- console.log(startdate); -->

            g = new Dygraph(
             document.getElementById("spo2_div"),
             "get-data3spo.php",  // path to CSV file
             { // rollPeriod: 7,
              legend: 'always',
              animatedZooms: true,
              showRoller: true
              //errorBars: true,
              //valueRange: [40,100]}          // options
             }
           );

           g = new Dygraph(
            document.getElementById("bpm_div"),
             "get-data3bpm.php",  // path to CSV file
             { // rollPeriod: 7,
              legend: 'always',
              animatedZooms: true,
              showRoller: true
              //errorBars: true,
              //valueRange: [40,100]}          // options
             }
           );
  </script>
</body>
</html>
The script that produces the oxygen information looks like this:
<?php
  ini_set("error_reporting",E_ALL);
  syslog(LOG_DEBUG,"Start get-data.php");

  # set db connection parameters
  $dbhost="10.1.1.1";
  #$dbhost="127.0.0.1";
  $dblogin="lograd8";
  $dbpwd="secret";
  $dbname="lograd8";

  $db =  mysql_connect($dbhost,$dblogin,$dbpwd);
  mysql_select_db($dbname);

  $rows  = "DatumTijd,gem_SPO2,spreiding_SPO2,max_SPO2,min_SPO2\n";

  #$startdate = $_POST['startdate'];
  $former=0;

  $query = "select date_format(tijd,'%Y/%m/%d %H:00') as datum,  avg(spo2) as gem_spo2, std(spo2) as spreiding_spo2,  max(spo2) as max_spo2,  min(spo2) as min_spo2   from data group by date_format(session,'%d/%m/%Y %H');";
  # +---------------+----------+----------------+----------+----------+
  # | datum_uur     | gem_spo2 | spreiding_spo2 | max_spo2 | min_spo2 |
  # +---------------+----------+----------+----------------+----------+

  syslog(LOG_DEBUG,"$query");
  $result = mysql_query($query);
  while($r = mysql_fetch_array($result)){
    #syslog(LOG_DEBUG,print_r($r,TRUE));
    $rij="";
    # vervangen min=0 door min=avg bij spo2 en bpm
    if ($r[4]==0) $r[4]=$r[1];
    for ($i=0;$i<=4;$i++) {
      $rij = $rij.$r[$i].",";
    }
    $rij=substr($rij,0,strlen($rij)-1);
    $rows = $rows.$rij."\n";
  }
  #syslog(LOG_DEBUG,print_r($rows,TRUE));
  #syslog(LOG_DEBUG,print_r($rows,TRUE));
  #echo $cols . '"rows":[',$google_JSON_row ."]}";
  # output off json string to caller.
  echo $rows;

  # saving of cvs string for debugging purposes
  #$fh=fopen("/tmp/get-data.cvs","w");
  #fwrite($fh,$rows);
  #fclose($fh);

  mysql_close($db);

  syslog(LOG_DEBUG,"Einde get-data.php\n\n");
?>
And, of course, the script to get the BPM info is very similar:
<?php
  ini_set("error_reporting",E_ALL);
  syslog(LOG_DEBUG,"Start get-data.php");

  # set db connection parameters
  $dbhost="10.1.1.1";
  #$dbhost="127.0.0.1";
  $dblogin="lograd8";
  $dbpwd="secret";
  $dbname="lograd8";

  $db =  mysql_connect($dbhost,$dblogin,$dbpwd);
  mysql_select_db($dbname);

  $rows  = "DatumTijd,gem_BPM,spreiding_BPM,max_BPM,min_BPM\n";

  $former=0;

  $query = "select date_format(tijd,'%Y/%m/%d %H:00') as datum,  avg(bpm) as gem_bpm, std(bpm) as spreiding_bpm,   max(bpm) as max_bpm,   min(bpm) as min_bpm     from data group by date_format(session,'%d/%m/%Y %H');";
  # +---------------+----------+---------------+---------+---------+
  # | datum_uur     | gem_bpm  | spreiding_bpm | max_bpm | min_bpm |
  # +---------------+----------+---------------+---------+---------+

  syslog(LOG_DEBUG,"$query");
  $result = mysql_query($query);
  while($r = mysql_fetch_array($result)){
    #syslog(LOG_DEBUG,print_r($r,TRUE));
    #syslog(LOG_DEBUG,print_r($tijd,TRUE));
    $rij="";
    # replace min=0 by min=avg for spo2 and bpm
    if ($r[4]==0) $r[4]=$r[1];
    for ($i=0;$i<=4;$i++) {
      $rij = $rij.$r[$i].",";
    }
    $rij=substr($rij,0,strlen($rij)-1);
    $rows = $rows.$rij."\n";
  }
  #syslog(LOG_DEBUG,print_r($rows,TRUE));
  #syslog(LOG_DEBUG,print_r($rows,TRUE));

  #echo $cols . '"rows":[',$google_JSON_row ."]}";
  # output off json string to caller.
  echo $rows;

  # saving of cvs string for debugging purposes
  #$fh=fopen("/tmp/get-data2.cvs","w");
  #fwrite($fh,$rows);
  #fclose($fh);

  mysql_close($db);

  syslog(LOG_DEBUG,"Einde get-data.php\n\n");
?>
The visual result of these scripts is as shown below:
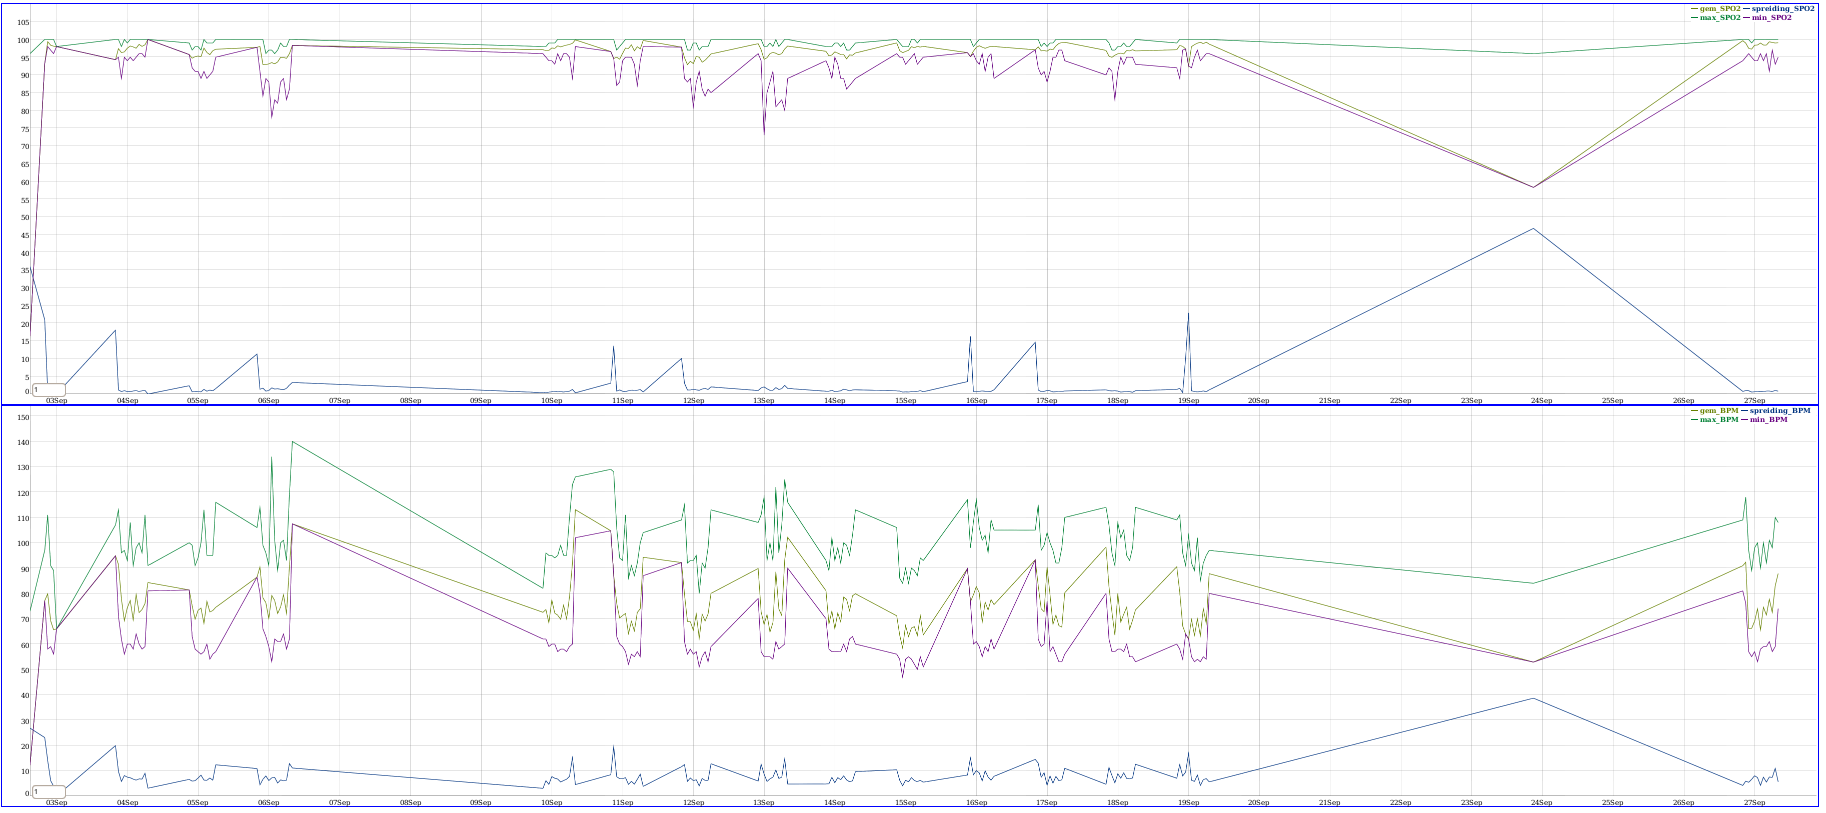
When we zoom in on the period of the 11th until the 13th of september we see that the hourly minimum SPO2 level keeps decreasing:
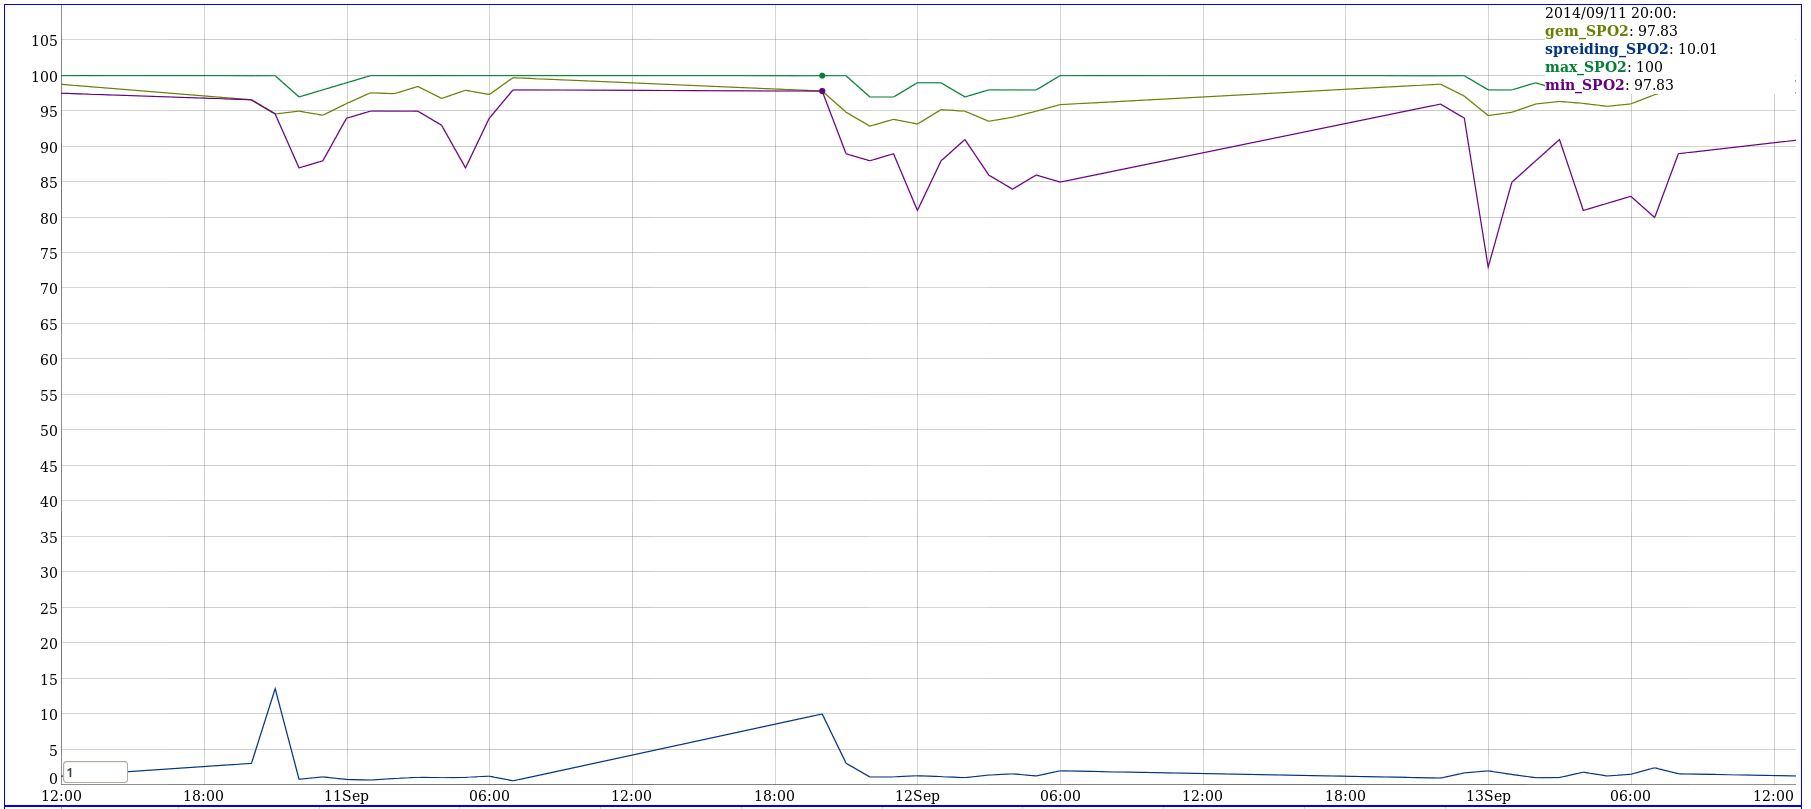
This was also a weekend where we did not give additional oxygen. We knew that the decreased oxygen level was something that was centrally managed (no airway blockage or lung problems). This proved to us, and more importantly to her physisian, that not giving oxygen at night would probably result in deterioration of her physical well being and subsequently the study at home ended.